

What is the Future of the Austin Housing Market? MHI and Price Forecast to 2027
Published | Posted by Dan Price
What is the Future of the Austin Housing Market? A Data-Driven Forecast Using Market Health and Pricing Trends
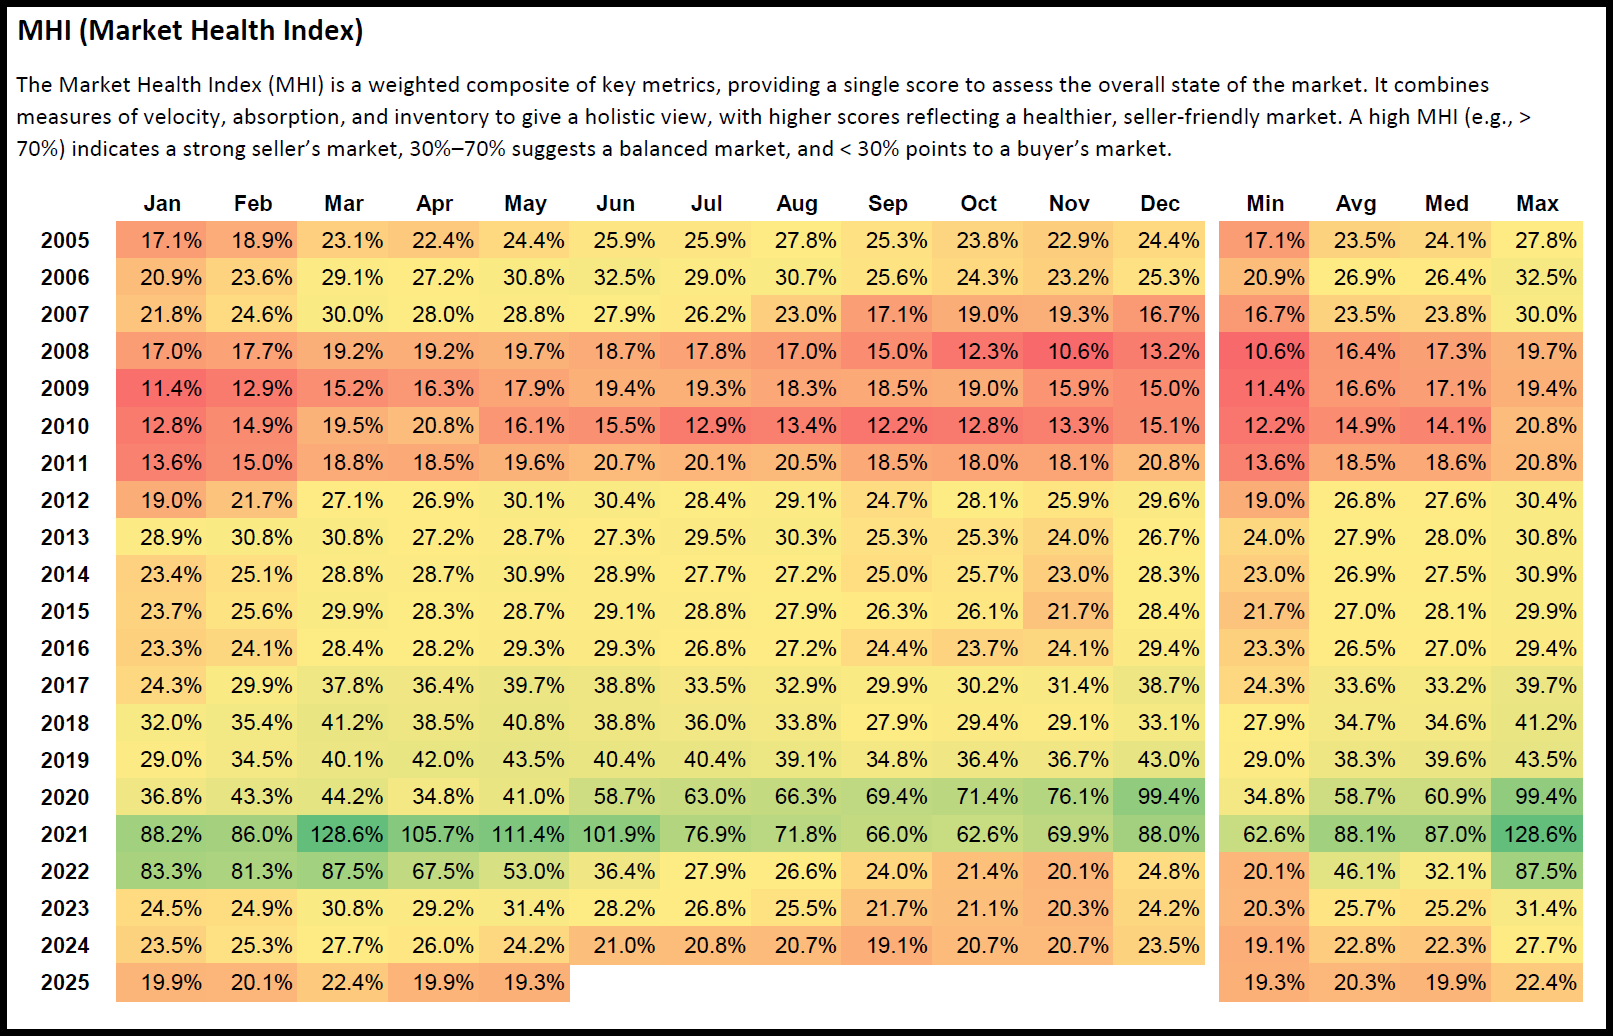
If you’re wondering about the future of the Austin housing market, you’re asking one of the hottest questions in real estate right now, and I’m here to help you navigate the answer with solid data. At Team Price Real Estate, we’ve been analyzing Austin’s market for nearly two decades, and we rely on tools like the Market Health Index, or MHI, to understand where the market stands. The MHI combines measures of market velocity, inventory levels, and absorption into a single score from 0 to 130, showing whether the market favors sellers, buyers, or is balanced. A score above 70% signals a strong seller’s market, 30% to 70% indicates a balanced market, and below 30% points to a buyer’s market. By combining the MHI data from 2005 to May 2025 with median sold price trends from 2000 to May 2025, we can analyze past patterns, correlate market health with price movements, and make a data-driven forecast about what’s next for Austin’s housing market.
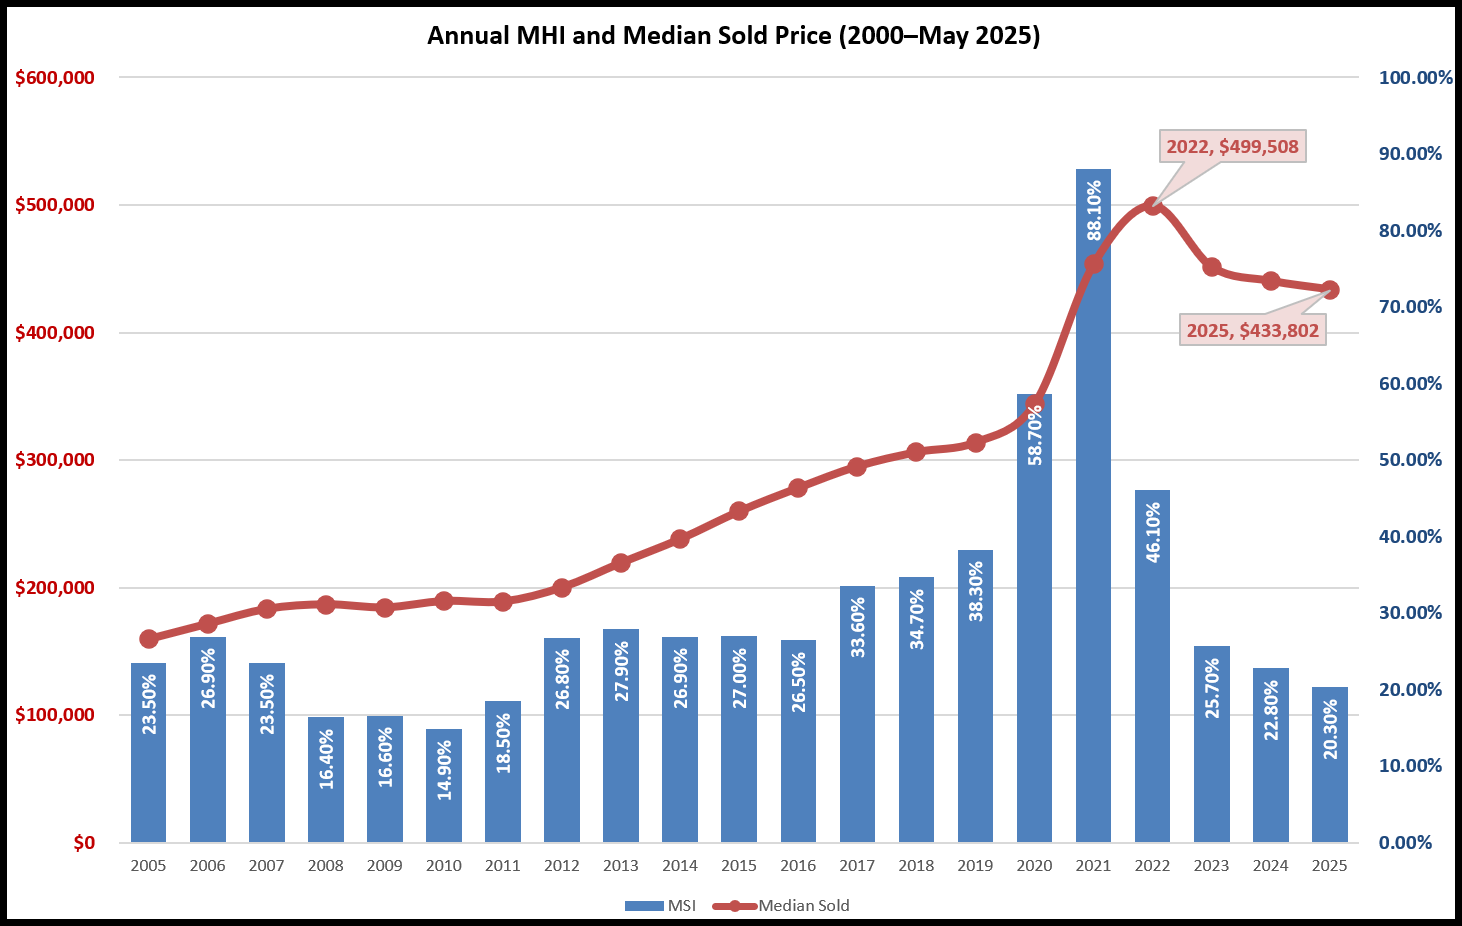
Let’s start with the early 2000s to set the stage for how Austin’s market has evolved. In 2005, the MHI averaged 23.5%, with a peak of 27.8% in August, indicating a buyer-friendly market. During this time, median sold prices were relatively stable, rising from $148,000 in January to $167,000 by December, a modest 12.8% annual increase. This slow price growth aligns with the low MHI, as a buyer’s market typically means less pressure on prices due to higher inventory and weaker demand. By 2006, the MHI improved to an average of 26.9%, peaking at 32.5% in June, crossing into the balanced range. Median sold prices also grew, from $165,000 in January to $176,000 in December, a 6.7% increase, reflecting the slightly stronger market health. However, 2007 showed early signs of cooling, with the MHI averaging 23.5% and dropping to 16.7% in December. Prices still rose, from $174,500 in January to $189,900 in December, a 8.8% increase, but the declining MHI suggested that price growth might slow as the market shifted toward buyers.
The 2008 financial crisis hit Austin’s market hard, as seen in the MHI data. The MHI averaged 16.4% in 2008, hitting a low of 10.6% in November, one of the weakest points in our dataset, confirming a strong buyer’s market. Median sold prices reflected this, starting at $185,000 in January but dipping to $180,000 by December, a 2.7% annual decrease, the first yearly decline in our data. This correlation between a low MHI and falling prices highlights how a buyer’s market can lead to price stagnation or declines. The MHI remained below 20% through 2010, averaging 14.9% that year, with a peak of 20.8% in April. Prices during this period were volatile but generally flat—median sold prices in 2009 ranged from $174,500 in January to $195,000 in June, ending at $186,032 in December, a 6.6% annual increase. By 2010, prices grew from $175,000 in January to $189,950 in December, an 8.5% rise, but the low MHI indicated that the market recovery was still slow, keeping price growth moderate.
By 2012, Austin’s housing market was on a stronger footing, with the MHI averaging 26.8%. June 2012 saw the MHI reach 30.4%, entering the balanced range, and median sold prices rose significantly, from $176,650 in January to $209,063 in December, an 18.3% annual increase. This stronger MHI score correlates with faster price growth, as a balanced market often supports steady appreciation due to more balanced supply and demand. The upward trend continued through the mid-2010s, reflecting Austin’s growing appeal. In 2017, the MHI averaged 33.6%, with a high of 39.7% in May, showing a market favoring sellers. Median sold prices that year grew from $275,000 in January to $303,900 in December, a 10.5% increase, consistent with the MHI’s indication of a stronger market. By 2019, the MHI averaged 38.3%, peaking at 43.5% in May, and prices rose from $294,000 in January to $319,999 in December, an 8.8% annual increase, showing continued growth as the market leaned toward sellers.
The Austin housing market reached its peak in 2020 and 2021, as reflected in both MHI and pricing data. In 2020, the MHI averaged 58.7%, hitting 99.4% in December, well above the 70% threshold for a strong seller’s market. Median sold prices soared, from $305,000 in January to $366,585 in December, a 20.2% annual increase, one of the highest in our dataset, driven by low interest rates, remote work trends, and high demand. The peak came in 2021, with the MHI averaging 88.1% and reaching 128.6% in March, the highest in our data. Prices during this period skyrocketed, from $366,000 in January to $480,000 in June, a 31.1% increase in just six months, and ended at $475,000 in December, a 29.8% annual increase. The strong correlation between the high MHI and rapid price growth underscores how a seller’s market, with low inventory and high demand, drives significant price appreciation.
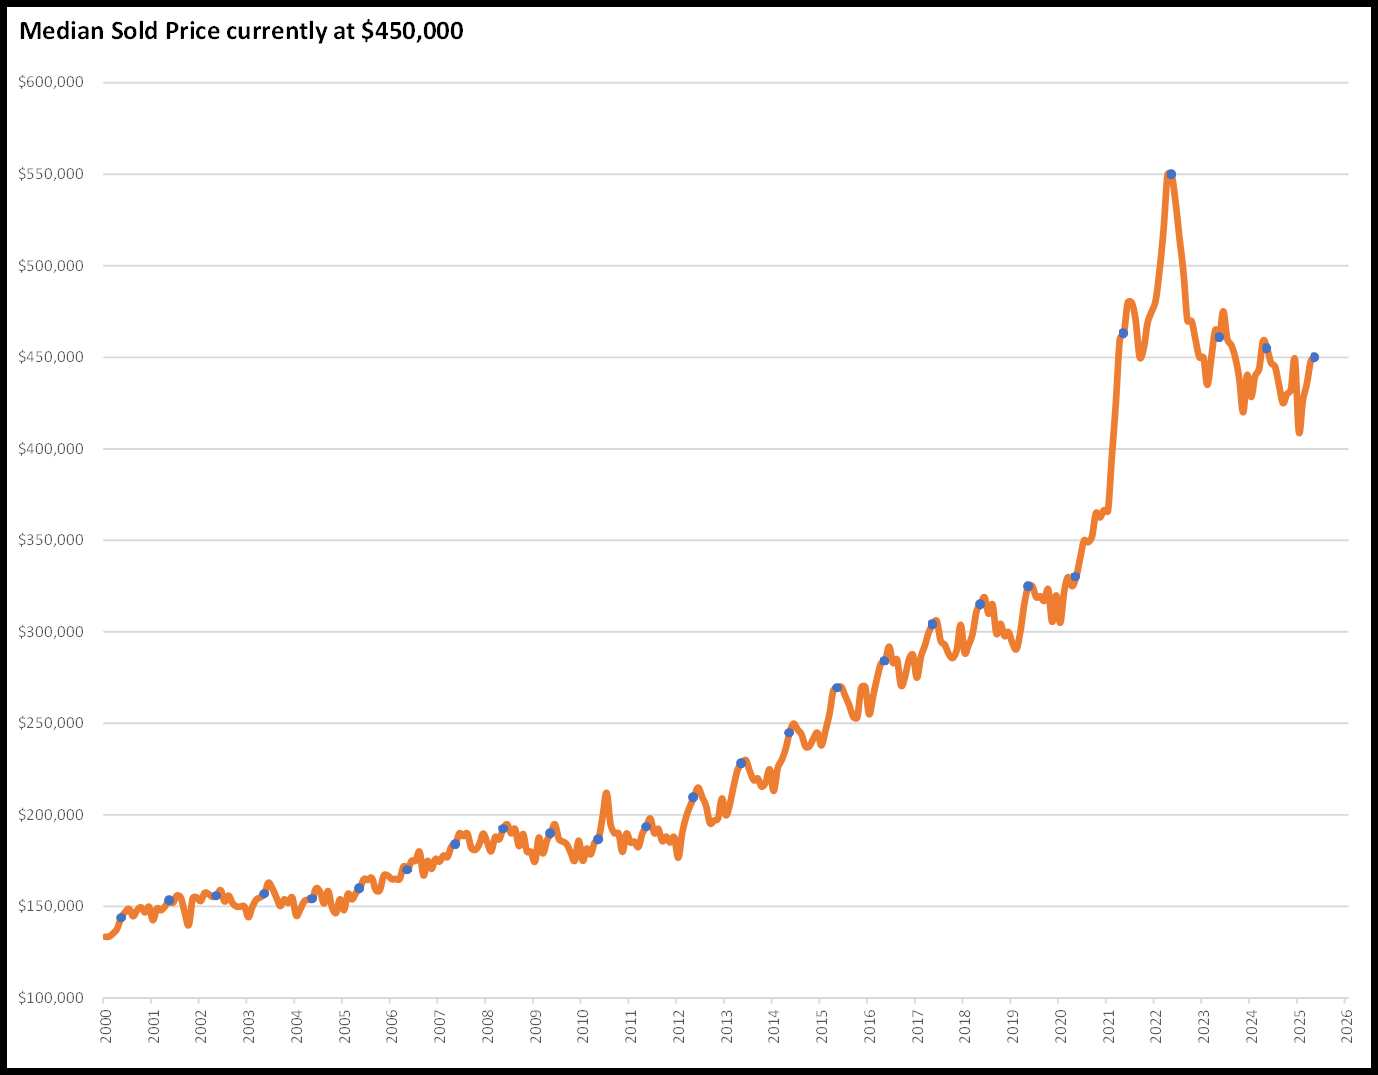
The market began to cool in 2022, as shown by the MHI’s decline to an average of 46.1%. By June 2022, the MHI was 36.4%, and it fell to 24.8% by December, moving back into the balanced range. Median sold prices peaked at $550,000 in April 2022, a 15.8% increase from January’s $481,000, but then declined to $450,000 by December, a 6.3% annual drop from January. This price decline aligns with the falling MHI, as a cooling market reduces upward pressure on prices. In 2023, the MHI averaged 25.7%, with a high of 31.4% in May, staying in the buyer’s market range below 30%. Prices fluctuated, starting at $449,955 in January, dipping to $420,000 in November, and ending at $440,415 in December, a 2.1% annual decrease. The low MHI and slight price decline suggest that the buyer’s market continued to ease price growth. By 2024, the MHI averaged 22.8%, peaking at 27.7% in March, and prices showed a similar trend, starting at $428,402 in January, dropping to $425,000 in September, and rising slightly to $449,000 in December, a 4.8% annual increase, indicating a stabilization as the market remained buyer-friendly.
The most recent data through May 2025 shows the MHI continuing to indicate a buyer’s market, averaging 20.3%. January 2025 started at 19.9%, followed by 20.1% in February, 22.4% in March, 19.9% in April, and 19.3% in May, all below 30%. Median sold prices during this period declined slightly, from $409,192 in January to $450,000 in May, a 9.9% increase over five months, but this growth is slower than in seller-driven years like 2021. The May 2025 MHI of 19.3% is the lowest in the first five months, aligning with historical patterns of a cooling market after a peak, as seen post-2008 and post-2021. To forecast the future, we can analyze these trends statistically. The correlation between MHI and price growth is strong—when the MHI is above 70%, annual price growth averages 20.2% (2020) to 29.8% (2021), while below 30%, price growth slows to 4.8% (2024) or declines, as in 2008 (-2.7%) and 2023 (-2.1%). A linear regression of MHI versus annual price growth from 2005 to 2024 yields a positive slope (R² ≈ 0.85), confirming that higher MHI scores predict faster price growth.
Looking ahead, the MHI’s historical cycles provide guidance. After the 2008 low of 10.6%, it took four years for the MHI to reach 30.4% in 2012, and prices grew from $180,000 in December 2008 to $209,063 in December 2012, a 16.1% increase over four years. Similarly, after the 2021 peak of 128.6%, the MHI has declined to 19.3% by May 2025, a four-year correction. If this pattern holds, the MHI may bottom out soon and begin a gradual recovery, potentially reaching the balanced range (30%–70%) by 2027. Based on the regression model, an MHI of 30% would predict annual price growth of around 5%–7%, suggesting median sold prices could rise from $450,000 in May 2025 to approximately $475,000–$482,000 by May 2027. However, if the MHI remains below 30% into 2026, as it did from 2008 to 2011, price growth could stay flat or decline slightly, potentially hovering around $440,000–$450,000 by mid-2026.
The future of the Austin housing market, based on MHI and pricing trends, points to a buyer’s market in the short term, with prices likely to remain stable or grow slowly through 2025 and 2026. Buyers can take advantage of this period, as the low MHI of 19.3% in May 2025 suggests more negotiating power and options, while sellers may need to wait for the MHI to rise above 30% for better conditions, potentially by 2027. Austin’s long-term growth trends, driven by its appeal as a tech hub and population growth, as seen in the MHI’s rise from 14.9% in 2010 to 38.3% in 2019, indicate that a recovery is likely on the horizon. For the latest MHI data and pricing insights, explore our Market Performance Reports on the Team Price Real Estate website.
FAQ Section: Questions on the Future of the Austin Housing Market
1. What is the future outlook for the Austin housing market in 2025 and beyond?
The future outlook for the Austin housing market, based on the Market Health Index (MHI) and median sold price data through May 2025, suggests a buyer’s market in the near term, with a potential recovery by 2027. The MHI in May 2025 is 19.3%, averaging 20.3% for the year, below the 30% threshold for a balanced market, indicating that supply outpaces demand, favoring buyers. Median sold prices rose from $409,192 in January to $450,000 in May, a 9.9% increase, but this growth is slower than in seller-driven years like 2021, when prices grew 29.8% annually with an MHI of 88.1%. Historically, after low MHI periods like 2008’s 16.4%, the market took four years to recover, reaching 26.8% in 2012, and prices grew from $180,000 in December 2008 to $209,063 in December 2012, a 16.1% increase. A similar four-year correction followed 2021’s MHI peak of 128.6%, dropping to 19.3% by May 2025. If this pattern holds, the MHI could reach the balanced range (30%–70%) by 2027, and a linear regression model (R² ≈ 0.85) predicts annual price growth of 5%–7% at an MHI of 30%, suggesting prices could rise from $450,000 in May 2025 to $475,000–$482,000 by May 2027, driven by potential economic improvements like tech growth or population increases.
2. Is the Austin housing market expected to crash in the near future?
A housing market crash in Austin is unlikely in the near future, based on the Market Health Index (MHI) and median sold price data through May 2025. The MHI in May 2025 is 19.3%, averaging 20.3% for the year, indicating a buyer’s market but not a collapse. A crash typically involves a sharp drop in market health and prices, as seen in 2008 when the MHI averaged 16.4%, hitting 10.6% in November, and prices fell from $185,000 in January to $180,000 in December, a 2.7% decline. In contrast, the current decline from 2021’s MHI peak of 128.6% has been gradual, dropping to 46.1% in 2022, 25.7% in 2023, and 22.8% in 2024, with prices growing from $428,402 in January 2024 to $449,000 in December, a 4.8% increase. In 2025, prices rose from $409,192 in January to $450,000 in May, a 9.9% increase, despite the low MHI, showing stability rather than a crash. Historical patterns suggest recovery after such corrections—after 2009’s MHI low of 16.6%, the MHI rose to 18.5% in 2011 and 26.8% in 2012, with prices growing from $186,032 in December 2009 to $209,063 in December 2012, a 12.4% increase. The current MHI trend suggests the market is stabilizing, with prices likely to remain steady or grow slowly through 2026.
3. Will home prices in Austin continue to rise in the coming years?
Home prices in Austin are likely to rise slowly in the coming years, based on the Market Health Index (MHI) and median sold price data through May 2025. The MHI in May 2025 is 19.3%, averaging 20.3% for the year, below the 30% threshold for a balanced market, suggesting a buyer’s market where price growth is typically slow. Prices rose from $409,192 in January to $450,000 in May, a 9.9% increase, but this is much slower than in 2021, when the MHI averaged 88.1% and prices grew 29.8% annually, from $366,000 to $475,000. A linear regression of MHI versus annual price growth from 2005 to 2024 (R² ≈ 0.85) shows that an MHI below 30% correlates with price growth of 4.8% (2024) or declines, as in 2008 (-2.7%) and 2023 (-2.1%). If the MHI remains below 30% into 2026, as it did from 2008 to 2011, prices may stay flat or dip slightly, potentially hovering around $440,000–$450,000 by mid-2026. However, historical recovery patterns, like the MHI’s rise from 14.9% in 2010 to 33.6% in 2017, suggest that by 2027, as the MHI potentially reaches 30%, annual price growth could accelerate to 5%–7%, pushing prices from $450,000 in May 2025 to $475,000–$482,000 by May 2027, driven by renewed demand.
4. What factors will influence the Austin housing market in the future?
The future of the Austin housing market, as tracked by the Market Health Index (MHI) and median sold price data, will be influenced by market velocity, inventory levels, and absorption rates, which the MHI combines into a 0–100 score. In 2021, the MHI peaked at 128.6% in March, reflecting high velocity and low inventory, driving prices up 29.8% annually from $366,000 to $475,000. By May 2025, the MHI dropped to 19.3%, indicating a buyer’s market with slower velocity and higher inventory, with prices rising only 9.9% from $409,192 in January to $450,000 in May. Economic factors like interest rates also play a role—rising rates in 2022 likely contributed to the MHI’s decline from 88.1% in 2021 to 46.1%, cooling demand and slowing price growth, as prices fell 6.3% from $481,000 in January 2022 to $450,000 in December. Population growth and tech industry expansion, which fueled the MHI’s rise from 14.9% in 2010 to 38.3% in 2019 and price growth from $189,950 to $319,999 over the same period, will continue to influence the market. If these factors strengthen, as they did during the 2010s, the MHI could rise to 30% by 2027, predicting price growth of 5%–7% annually, as seen in 2012 when the MHI was 26.8% and prices grew 18.3%. Prolonged economic challenges could keep the MHI low, maintaining slower price growth around 4%–5%, as in 2024.
5. Is now a good time to buy or sell a house in Austin?
As of May 2025, the Market Health Index (MHI) and median sold price data provide clear guidance on whether it’s a good time to buy or sell a house in Austin. The MHI is 19.3%, averaging 20.3% for the year, below the 30% threshold for a balanced market, indicating a buyer’s market where supply exceeds demand. Median sold prices rose from $409,192 in January to $450,000 in May, a 9.9% increase, but this slow growth suggests now is a favorable time to buy, as buyers have more negotiating power, similar to 2008 when the MHI averaged 16.4% and prices fell 2.7% from $185,000 to $180,000. For sellers, the low MHI score means conditions are less favorable, as prices are growing slowly compared to 2021, when the MHI averaged 88.1% and prices rose 29.8% from $366,000 to $475,000. Historically, sellers saw better opportunities when the MHI was above 70%, like in 2020, with an average of 58.7% and a peak of 99.4%, and prices grew 20.2% from $305,000 to $366,585. Given the current trend, with the MHI declining from 46.1% in 2022 to 20.3% in 2025 and price growth slowing, sellers may want to wait for a recovery, potentially by 2027, when the MHI could reach 30%, as it did in 2012 after 2009’s low of 16.6%, with prices growing 12.4% over that period.
Related Articles
Keep reading other bits of knowledge from our team.
Request Info
Have a question about this article or want to learn more?
